While searching websites for my recent post about Place on Google I discovered a number of diagrams that illustrate the concept of sense of place. These are the five I think most useful and informative.
- A Triangle of Identity and Attachment
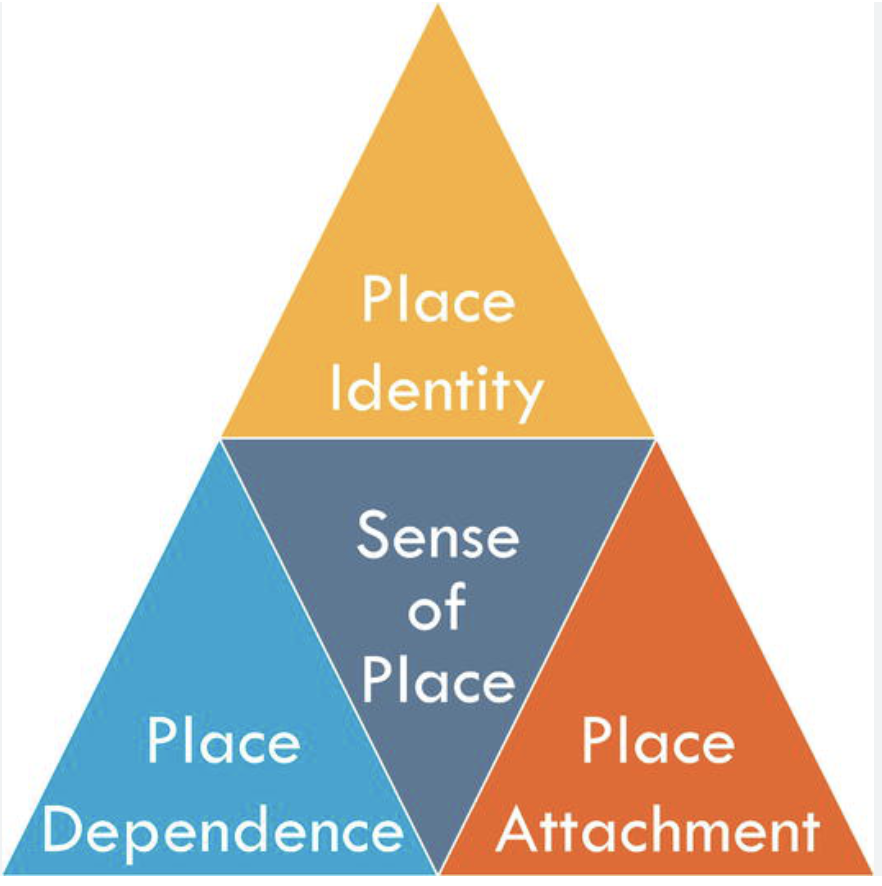
This triangle of triangles puts the emphasis on the sense aspect of sense of place by emphasizing identity and attachment. These are concepts that are important in psychological studies of place, so I find it intriguing that this diagram is in a chapter an edited volume about water quality in which most of the chapters focus on pollution and technical concerns. The authors argue that “sense of place offers promise as a tool for measuring an important aspect of the social value of water quality.”
Source: Kate K. Mulvaney, Nathaniel H. Merrill and Marisa J. Mazzotta, 2020, “Sense of Place and Water Quality: Applying Sense of Place Metrics to Better Understand Community Impacts of Changes in Water Quality” in Kevin Summers, ed. Water Quality: Science, Assessments and Policy, InTech Open [an open access peer-reviewed edited volume], accessed online here.
2. An Inverted Triangle of Built Form and Activity
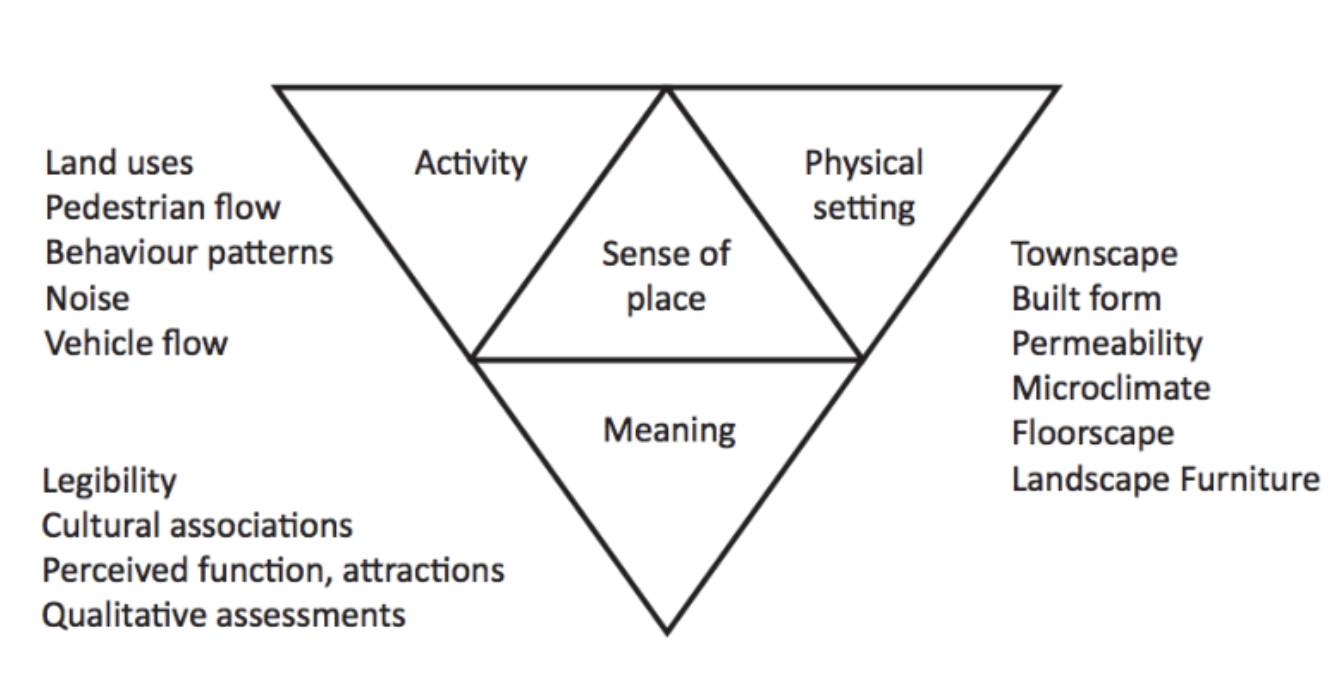
Another triangle diagram that identifies three different components because it puts the emphasis on the place aspect of sense of place, reflecting how it is viewed in terms of built environments by planners and some geographers. The context is also interesting because this is in a paper that examines the ways electronic media are impacting sense of place, though this diagram does not capture those.
Source: Mai Ahmed and Peter Zelle 2020 “Places’ representation on social media – A study to analyze the differences between the virtual communities and the offline environment” Conference paper REAL CORP 2020 Proceedings/Tagungsband, accessed here. (They acknowledge that this is partly based on a diagram in J. Punter, 1991 “Participation in the design of urban space” Landscape design , 200, 24-27.)
3. A Web of Indicators
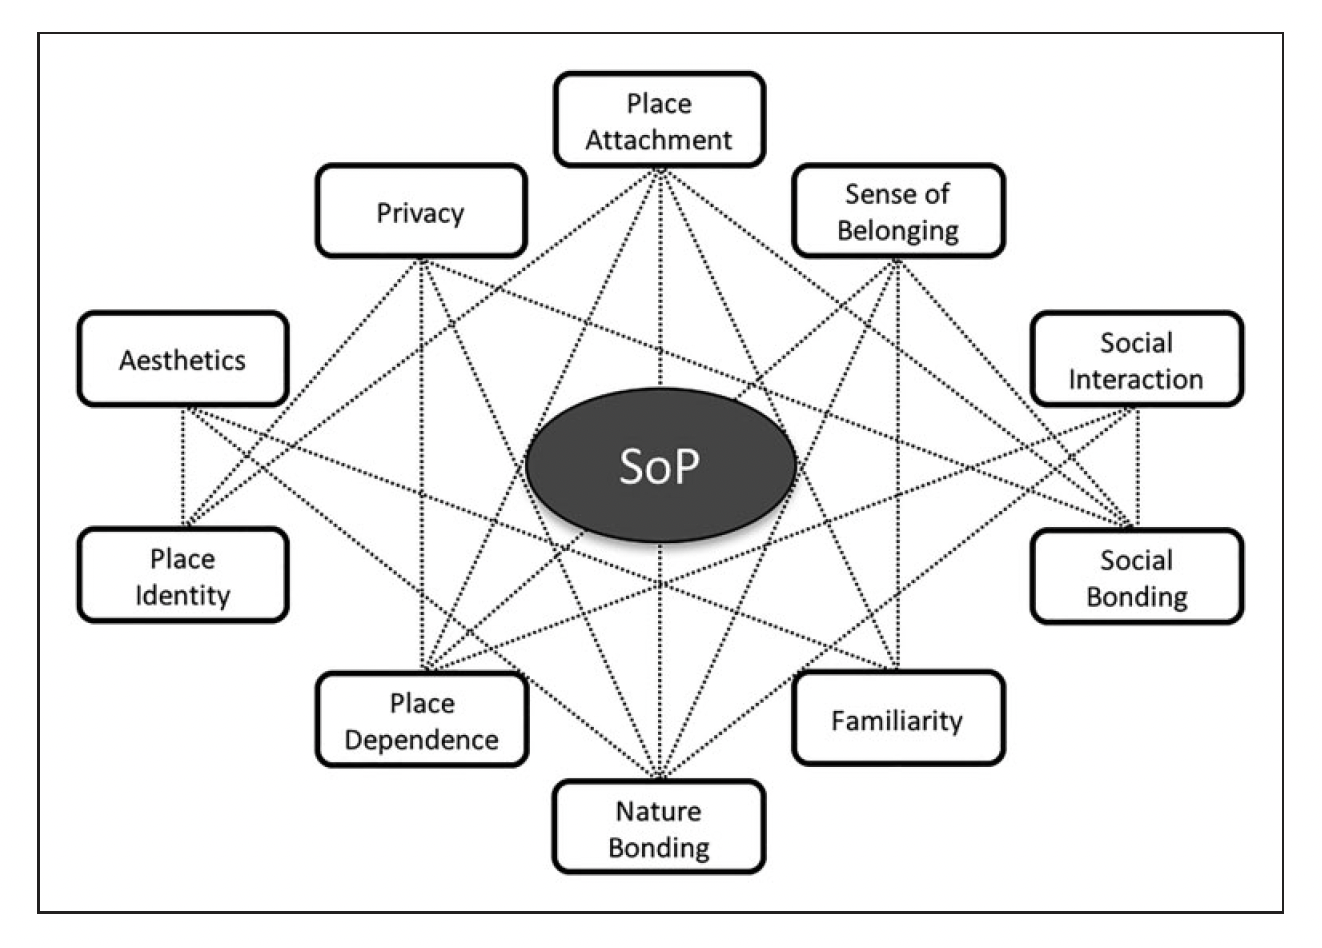
This more complex diagram includes components from the two triangle diagrams above, adds others, and suggests links between what the authors call “place indicators.” The suggestion is that sense of place, as it relates to houses and built forms, can be understood as the centre of a web of interconnected social, individual and environmental aspects of places and experience of place’.
Source: Duygu Gokce and Fei Chen 2018 “Sense of Place in the changing process of house form: Case studies from Ankara, Turkey”, Environment and Planning B, 45 (4) p. 774 July 2018, accessed online here
4. A Venn Diagram of Individual, Community and Place
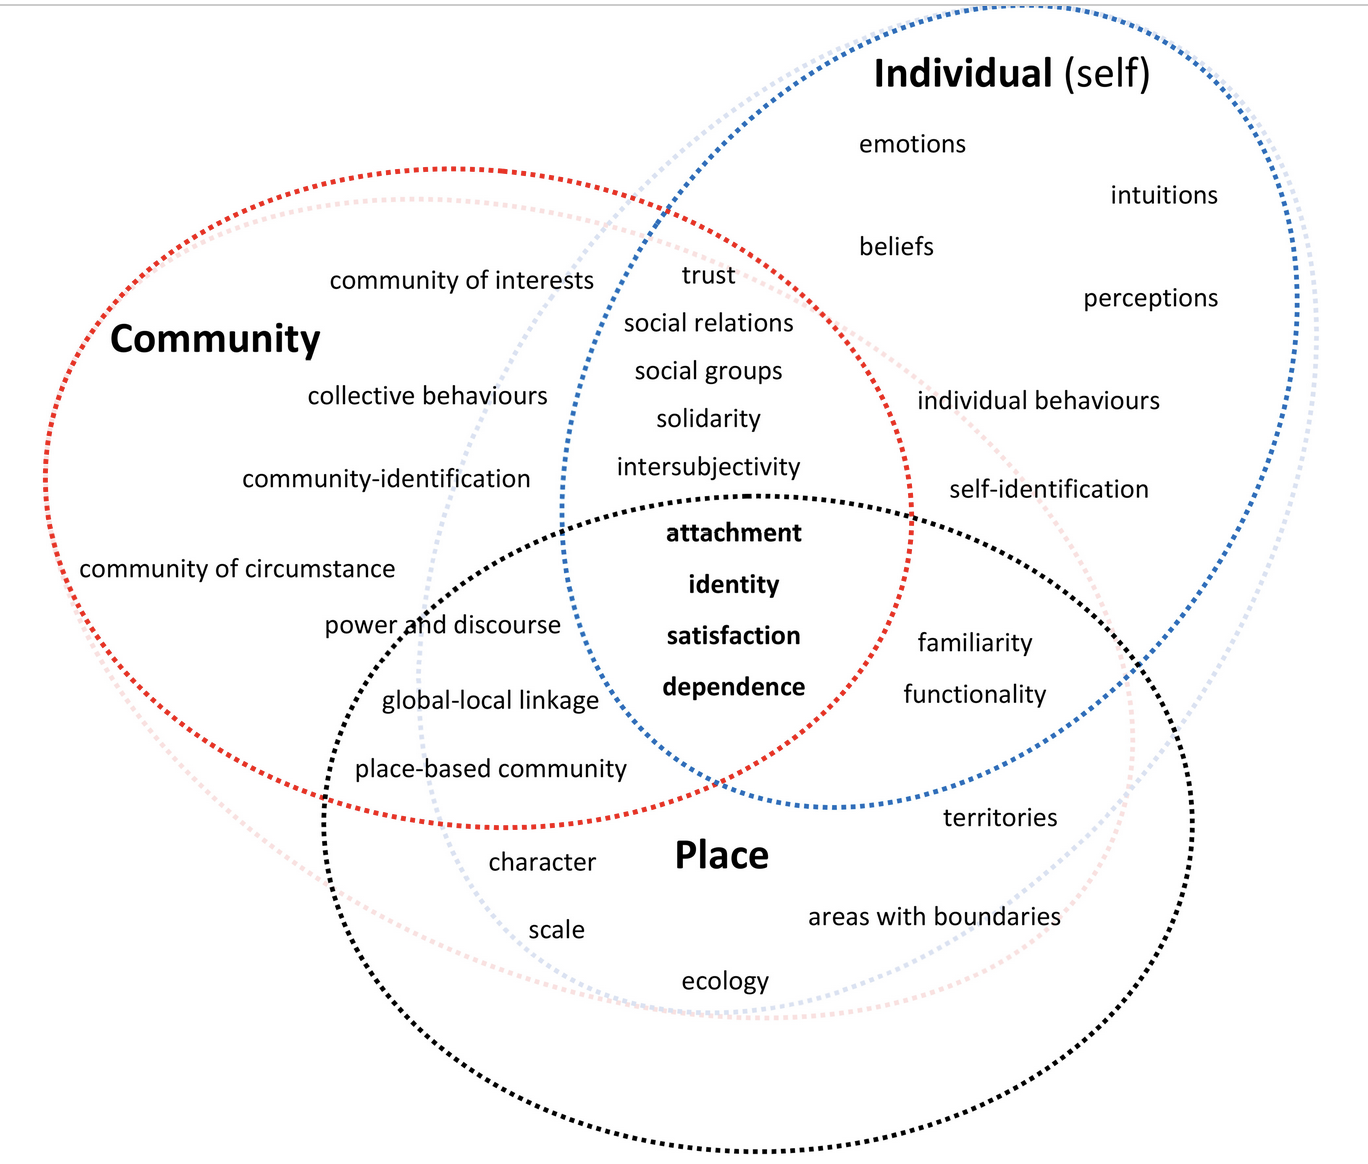
This Venn diagram combines elements of the three previous diagrams, and is I think the most sophisticated of all five images I show here. Sense of place is not labelled, but is implicitly in the centre where the three loops overlap. Although the emphasis is social and psychological, the details about global-local linkage, familiarity, power and discourse, intersubjectivity, etc, extend the range for how sense of place needs to be understood, and also suggest its the subtleties and complexities. The way that the various sub-components are loosely clustered acknowledges that their relationships are flexible and varied. It is worth noting that the- the author teaches in a Department of Nursing – interest in place has few disciplinary boundaries.
Source: Goran Erfani 2022 “Reconceptualising Sense of Place: Towards a Conceptual Framework for Investigating Individual-Community-Place Interrelationships”, Journal of Planning Literature, Vol 37, No. 3 accessed online here
5. Circles, Radii, and Words
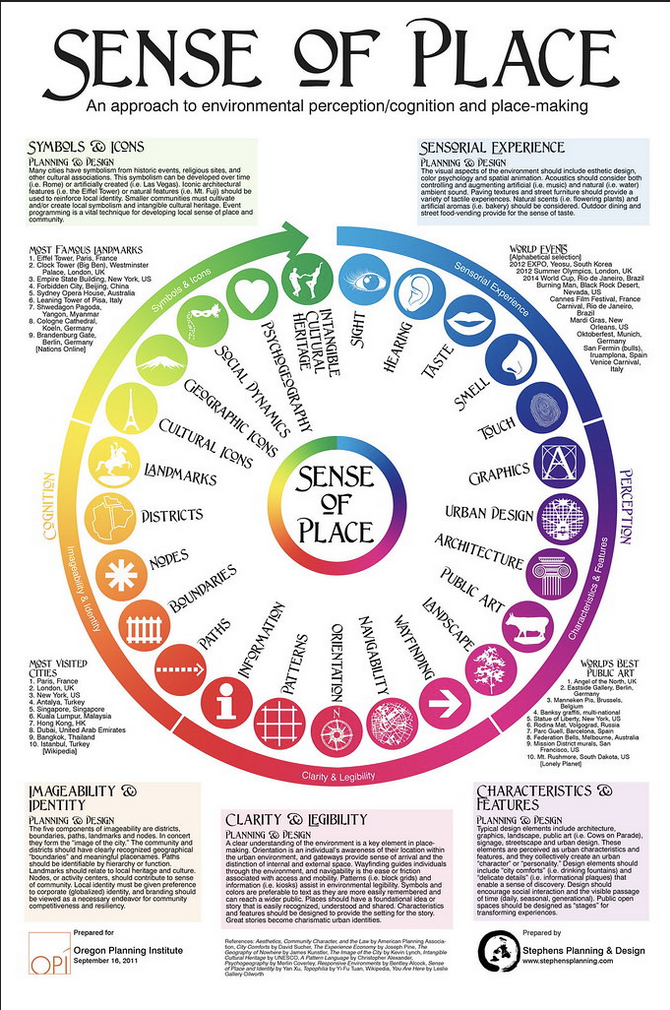
This visually powerful diagram of sense of place is based on ideas about urban design that are taken from Kevin Lynch’s work on the image of the city (cited bottom left). It can be read, I think, as an elaboration of the inverted triangles about built form and activity shown above. At first glance I found it striking. and it certainly has a lot of information with the combination of diagram and text. However, on reflection I think there is too much going here for the diagram to be really effective; it is cluttered with circles, radial patterns, the ring of little badges, the outer band divided into segments, lists of landmarks, events, world’s best public art, most visited cities. And in spite of this it conveys fewer ideas than the Venn diagram. However, if your interest in specifically in sense of place from the perspective of urban and built environments, this should be helpful.
Source: Ric Stevens 2011 “Sense of Place: An approach to environmental perception/cognition and placemaking”, Prepared for the Oregon Planning Institute, accessed online here: