In a previous post I provided a synopsis of what I think are the four most important interacting trends that will affect the future of places – the place legacy, demographic changes, urbanization and climate change. To keep my discussion concise I abbreviated some data that supports my argument and did not refer to all the sources I had used. This (and two other posts, on urbanization, and on climate change and worldviews) are really long footnotes or appendices to that previous post which provide background material, data, and details about sources I used.
In this post I discuss existential risks and tipping points (which I only mentioned briefly in the synopsis of the future of places), and data and sources supporting both my suggestion that last seventy years created the largest ever legacy of places, and projections for peak population and decline later in this century.
Existential Risks and My Approach
In November 2016 the New Scientist, to acknowledge the 60th anniversary of its first edition, speculated about what the next sixty years might hold. The editors noted sagely that thinking about the future will be bound to get most things wrong but nevertheless noted that there are growing environmental, economic and political threats, artificial intelligence could go rogue, and civilization is a complex adaptive system potentially subject to catastrophic failure.
This mostly bleak view of the future is widely shared, but there are some optimists who stress the incredible accomplishments in science and technology, and in reducing poverty and improving health and well-being, over the last two centuries and see no reason to assume that this sort of progress will not continue { e.g. Matt Ridley The Rational Optimist http://www.rationaloptimist.com/blog/best-decade-in-history/; Johan Norberg Progress: Ten Reasons to Look Forward to the Future; Stephen Pinker Enlightenment Now).
My approach to the future of places falls somewhere between those extremes of bleakness and progress. It is based mostly on projections of trends (population, urbanization, climate change) for which strong evidence is available, and the possible interactions of these. There are, however, three ways these can be wrong that I scarcely mentioned in my post on the Future of Places.
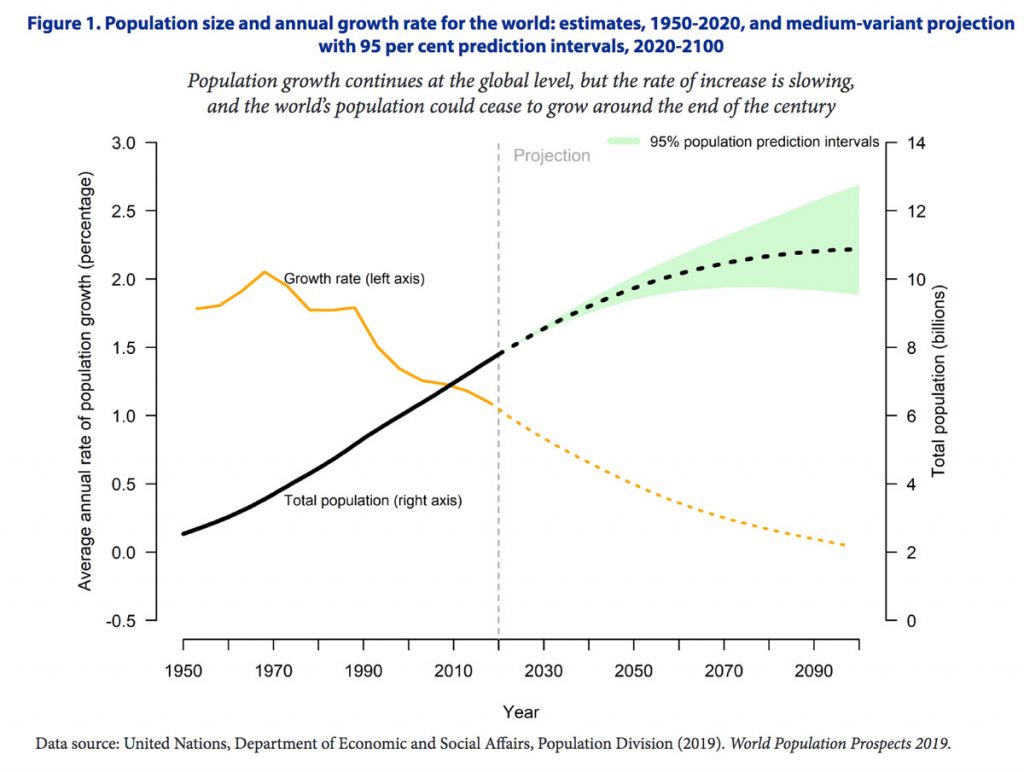
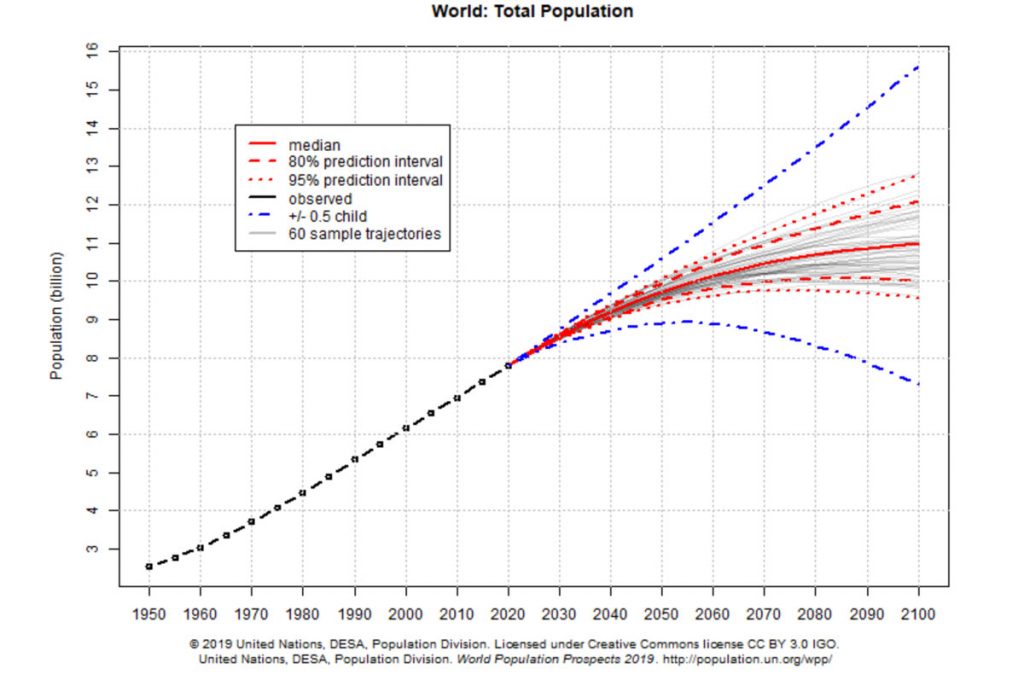
First, while projections for the next decade or two are reasonably dependable, they become increasingly uncertain the further they are from the present. This is made very clear in the UN diagram showing the range of population projections for 2100 (see below under Population Growth).
Secondly, trends can be upset by exceptional events such as nuclear conflicts, the possibility of artificial intelligence becoming self-reproducing in ways beyond human control, or widespread political and social upheaval (and perhaps more pandemics). These are unpredictable and their consequences for places are uncertain. Concerns about them are expressed in the Doomsday Clock of the Bulletin of Atomic Scientists https://thebulletin.org/doomsday-clock (which currently shows how dire are the combined threats of nuclear war and climate change, compounded by possible cyber enabled warfare and weakening international security), The Centre for the Study of Existential Risk at the University of Cambridge, and The Future of Humanity Institute at Oxford University.
Thirdly, there is the possibility of tipping points leading to a cascade of unexpected changes. These are much discussed in models of climate change but the idea has wider application (see this article in Nature).
A tipping point occurs when change, whether rapid or slow, become irreversible as it passes a threshold that leads to a different stable state (for instance, melting of Arctic sea ice could lead to a shift in the circulation of Atlantic Ocean currents which will not revert to its previous condition even if processes that led to the change are removed). For places social and political revolutions and technological innovations (such as the invention of the city, and automobiles and mass production) have been critical tipping points. It is possible that the development of electronic media will lead to a social tipping point in this century, as could rapid climate warming.
There also appear to be growing possibilities of major political and social shifts in the 21st century – including the decline of democracy (e.g. Anne Applebaum’s recent book The Twilight of Democracy), the end of capitalism as we know it (even the World Economic Forum is speculating about a great reset), and increasing inequality (e.g.Thomas Piketty, see his World Inequality Database), that could separately or in combination lead to revolutions and violence both national and international. These would obviously have profound impacts on place experiences, and perhaps on placemaking and the character of places as institutions and social relationships are reorganized.
Legacy of Present Places
In my post on the Future of Places I claimed that the unprecedented scale of recent changes to places plus the fact that this scale of change will never be repeated because rates of population growth have peaked, has the consequence that the legacy of present places will inevitably play a major role in the future of places. Without pressure to rebuild and expand much of what we have now will stay much as it is.
Here are some population data that support this assertion, taken from UN Population Prospects 2019 (go to>Data Files>Standard Projections>Total Population Both Sexes which provides populations for the world, more and less developed regions, and individual countries from 1950 to 2100. Forecasts to 2100 are on separate sheets in the Excel Spread Sheet). I have used the Median Variant Projection, which is the considered the most likely one.
| 1950 | 1960 | 1970 | 1980 | 1990 | 2000 | 2010 | 2020 | |
| World Population (billions) | 2.5 | 3.0 | 3.7 | 4.5 | 5.3 | 6.1 | 7.0 | 7.8 |
| 2030 | 2040 | 2050 | 2060 | 2070 | 2080 | 2090 | 2100 | |
| Projected World Population (billions) | 8.5 | 9.2 | 9.7 | 10.2 | 10.5 | 10.7 | 10.8 | 10.9 |
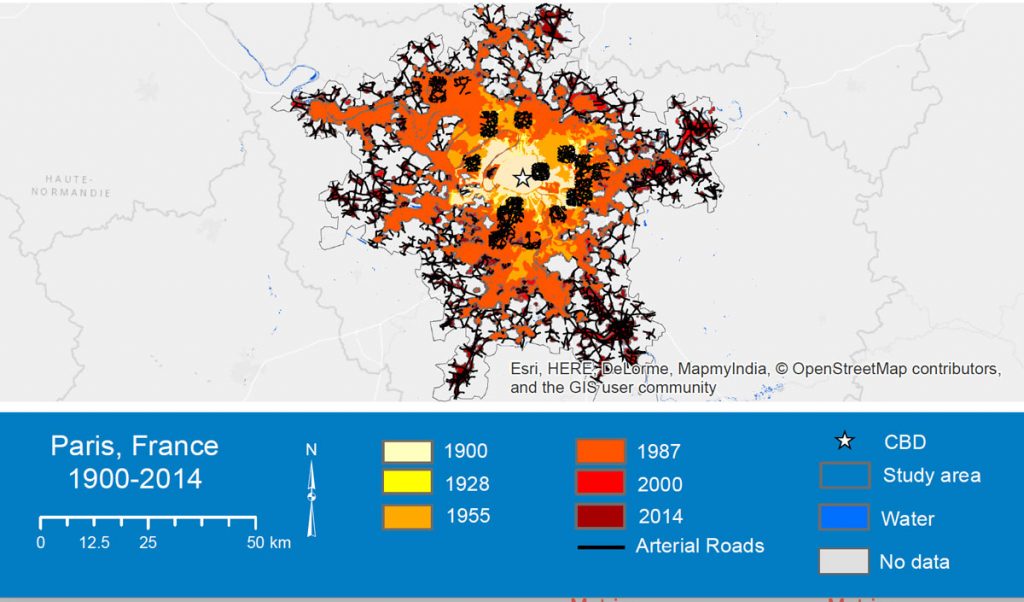
The time sequences (animations) of urban growth in 30 major cities in different parts of the world available at the online Atlas of Urban Expansion effectively convey the scale of recent place growth cartographically. I find the animations for Beijing, Sydney, Cairo, Shanghai, Tokyo, and Paris particularly interesting.
My key point is that because population is a driver of placemaking, the last 50-70 years have seen the greatest expansion of and changes to places that is ever likely to occur. From now on population pressure to build more places and expand existing ones will decrease, especially in the developed world. Only in Africa will place creation driven by population growth continue until the end of the century. And by 2100 it seems very probable that, for the first time ever there will be no overall population increases driving placemaking practices.
Population Growth
Population projections are based on assumptions about fertility, mortality and migration that become increasingly uncertain with time from the present. The UN provides a number of projections using different assumptions. For 2100 the range is from a low of 7.5 billion to a high of over 15 billion, a range roughly equivalent to the current global population. In between these the median variant is considered the most likely and is the one most frequently cited.
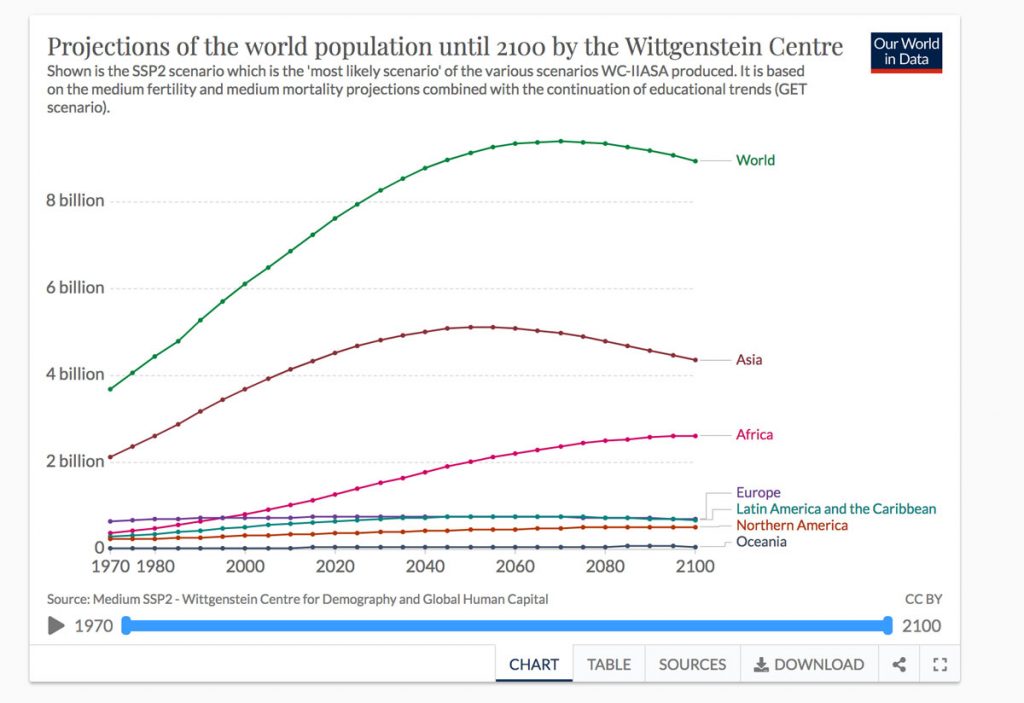
Excellent summaries and illustrations of population growth (based on the UN data) are available at ourworldindata. This website also illustrates the population forecast of the Wittgenstein Centre for Demography, which has a median forecast showing global population peaking about 2070, thirty years sooner than the UN forecast. The difference is mostly because of different assumptions about growth in Africa.
To understand the impact of population growth on places it is helpful to look at where and when most recent growth has happened and is forecast to happen. One way to do this is to compare population added per decade using the categories of More Developed Regions (Japan, Europe, North America, Australia and New Zealand) and Less Developed Regions (everywhere else), that the UN has used since 1950.
| 1950-59 | 1960-69 | 1970-79 | 1980-89 | 1990-99 | 2000-10 | 2010-20 | |
| World | 499m | 665m | 758m | 869m | 816m | 813m | 838m |
| More dev | 102m | 92m | 75m | 62m | 43m | 46m | 39m |
| Less dev | 397m | 573m | 683m | 807m | 773m | 767m | 799m |
| 2020-29 | 2030-39 | 2040-49 | 2050-59 | 2060-69 | 2070-79 | 2080-89 | 2090-99 | |
| World | 754m | 650m | 536m | 416m | 308m | 215m | 136m | 66m |
| More dev | 13m | 1m | -7m | -13m | -13m | -8m | -3m | 1m |
| Less dev | 741m | 650m | 544m | 429m | 321m | 223m | 139m | 66m |
In Less Developed Regions (and the world as a whole) growth per decade peaked in the 1980s and will continue at slowing rates until the end of the century (or sooner if the Wittgenstein and Lancet projections are correct). Growth per decade in More Developed Regions peaked in the 1950s and will slide into absolute decline in the 2040s, possibly stabilising at the end of the century. The UN population projections for individual countries show that most of the decline will be because of drops in Japan and some European countries, while North America and Australia are expected to continue to grow slowly.
| Russia | Japan | Poland | Ukraine | Italy | Spain | Greece | |
| 2020 | 145m | 125m | 38m | 43m | 60m | 47m | 10m |
| 2030 | 143m | 120m | 37m | 40m | 59m | 46m | 10m |
| 2050 | 135m | 100m | 33m | 35m | 54m | 43m | 9m |
| 2100 | 126m | 75m | 23m | 24m | 40m | 33m | 6m |
| Total Decline 2020-2100 | -19m | -52m | -15m | -19m | -20m | -14m | -4m |
The Lancet projections, which assume low fertility rates, indicate more substantial declines – with 23 countries showing a population of decline of 50 percent between now and 2100, including Japan, Thailand, Ukraine, Spain, Hungary, Poland, South Korea, Greece and Italy.
In some countries in More Developed Regions, for instance Germany and the U.K., populations have been maintained or increased slowly by immigration. Population forecasts in these countries have to make assumptions about continuing immigration policies. In the United States the Census Bureau offers a series of projections based on assumptions about zero, low, high and present rates of immigration. With zero immigration the present population of 330 million could drop to 326 million by 2050, and with high immigration it could increase to 420 million. With continuation of present immigration policies the population should increase to about 380 million in 2050.
Peak population followed by decline raises numerous issues for social and health planning. The population projections in The Lancet consider these and also economic implications and impacts on GDP. The conclusion is that these are variable, so Italy and Spain may see a drop in GDP but this will not be the case in Japan. A more fundamental question is whether overall economic growth is dependent on population growth, and population decline will have to involve the development of a new sort of economics based on sustainability without growth. (See: Wesley Peterson, 2017, “The Role of Population in Economic Growth.) If this is the case there is bound to be an impact on the character of places. However, there is no consistent answer, not least because Japan, where the population is aging but the total has not changed much for 20 years (about 127 million), has increased its GDP per capita faster than the United States, where the population has increased by 50 million since 2000.