Recent and Current Trends Affecting Places
In this and the two following posts I outline trends in the processes that are currently impacting places. I have discussed some of these processes in three previous posts on this website, noting how distinctiveness of places has been reasserted since about 1970 (when the placeless practices of the Modern Era began to be questioned), how experiences have been affected by increased mobility, and how theoretical notions of place have been elaborated. In the two next posts I will variously summarise and elaborate those discussions. Here I want to consider the ways that long-term processes, especially population and urban growth, are affecting places.
Uneveness and Other Recent Shifts in Population Growth
Population growth has been in the background of making places throughout human history (see my comments in History of Places 10,000 BCE to 1,000 CE). In the last fifty years there have been significant shifts in how this plays out.
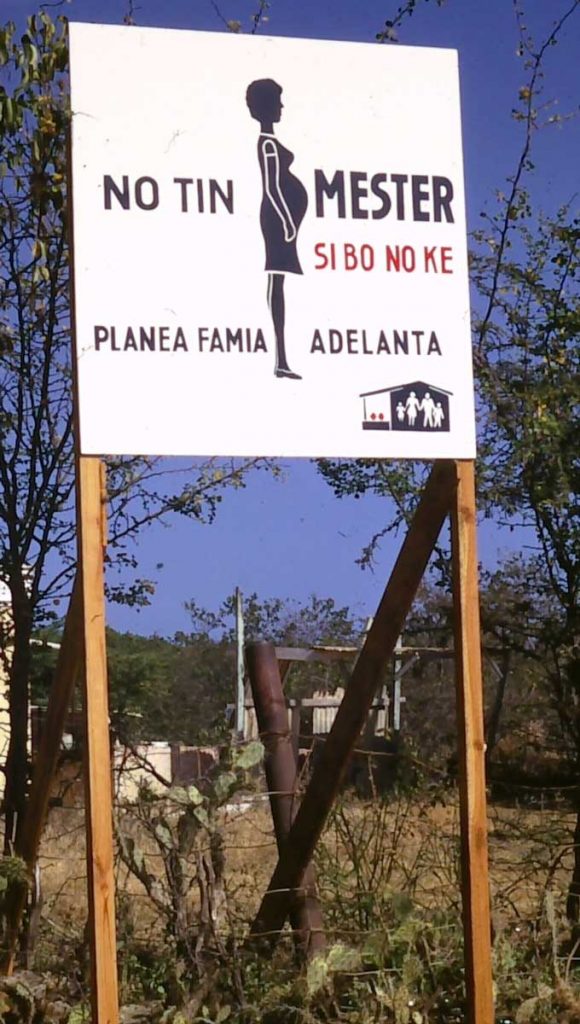
First, while we are still living through the enormous acceleration of population growth that began in the late 18th century (from just under 1 billion then, to 3.7 billion in 1970, to about 7.8 billion in 2020), the rate at which this growth is happening peaked in the 1960s at about 2.2% a year, and has steadily declined since then to about 1.05% (probably because of programmes of population control and improvements in standards of living, like the one illustrated). Growth continues but ever more slowly and this downward turn is unlikely to be reversed. For places this was a pivotal moment because for the first time an end is in sight to the trend of more places to accommodate more people.
Secondly, paralleling this reduction in rate of growth, life expectancy has increased. In 1950 global life expectancy was about 50 years, roughly where it had been for much of human history. By 1970 it has risen to about 60 years and is now 73 years. In Europe and North America life expectancy is in the order of 80 years. To put it simply, populations everywhere are aging. For places this is significant because it means that they, too, are showing signs of aging and decline.
Global population numbers mask considerable variations. About 90 percent of the worldwide increase of 4.0 billion since 1970 has happened in Africa and Asia, and there places, especially towns and cities, have had to expand rapidly to accommodate more people. However Europe has witnessed a remarkable drop in population growth. Since 1970 in many European countries – Germany, Spain, Italy, Austria, Hungary, France, Britain, Russia – the fertility rate has fallen well below 2.1 children per woman, the rate needed just to maintain an existing population. There is always a time lag before population totals begin to reflect changes in fertility rates, but this drop in fertility rates means that without some intervention (such as the policies introduced in 2019 in Hungary to try to boost the birth rate), populations will get older, there will be fewer young people, and totals will inevitably decline. Something similar has happened in Japan, Canada, and Australia; the US is a bit of an exception because its replacement rate has hovered just under 2.0 (data on replacement rates are here).
An aging or declining population has significant consequences for economic growth (more money needed for pensions, less consumption of goods). Presumably because of this (though it is rarely stated explicitly) potential declines have been offset by national policies to increase immigration, most of which has been from less developed countries, including former colonies, where populations continue to grow. Immigration is the reason that Europe’s population has grown by 100 million since 1970, and North America’s by 150 million. These are small increases by comparison with the 3.7 billion in the rest of the world, but have been sufficient to allow most cities, where most immigrants settle, to continue to expand (albeit in ways that have transformed and diversified their cultural character – I discuss this further in the next post).
Uneven Urban Growth
Population growth over the last 50 years has been increasingly concentrated in urban areas. In 1970 urban areas in the world had 37 percent of the world’s population, in 2020 they have 56 percent. As long as the rate of urban growth remains higher than the population growth rate this urban intensification will continue. Again, these global numbers mask major variations – in Japan 90 percent of the population lives in urban areas, in North American 80 percent, in European countries 70 to 75 percent; in Africa is the population still mostly rural.
There is another significant uneveness in urban growth – over the last 50 years it has mostly been in very large cities. In 1950 there were about 175 cities with populations over 500,000, accommodating 33% of the world’s urban population; in 1970 there were 335 over 500,000, housing 40%; in 2020 there are 1200, housing 57% of the urban population or one third of the total global population. In addition, the last seventy years have seen remarkable growth in megacities (cities with populations over 10 million). In 1950 there were just two of these (New York and Tokyo), in 1970 there were three, now there are 34 according to the UN World Urbanization Report (other sources claim as many as 47 because they measure the size of cities differently). Whatever the number, the undeniable fact is that over the last fifty years large urban places have been getting larger and larger, building upwards and outwards to create megalopolitan areas that are continuously built-up for a hundred kilometres or more. One incidental consequence is that when we talk now of cities we are referring to something very different from the relatively small places that were considered to be cities throughout most of history.
| City Population | 1950 | 1970 | 2020 | 2035 |
| >10 million | 2 | 3 | 34 | 48 |
| 5-10 million | 5 | 15 | 51 | 73 |
| 1-5 million | 69 | 127 | 494 | 639 |
| 0.5-1 million | 101 | 190 | 626 | 757 |
Number of cities in the world by population size, 1950, 1970, 2020, projected to 2035
Source: (United Nations 2018, World Urbanization Prospects, Data File 12,
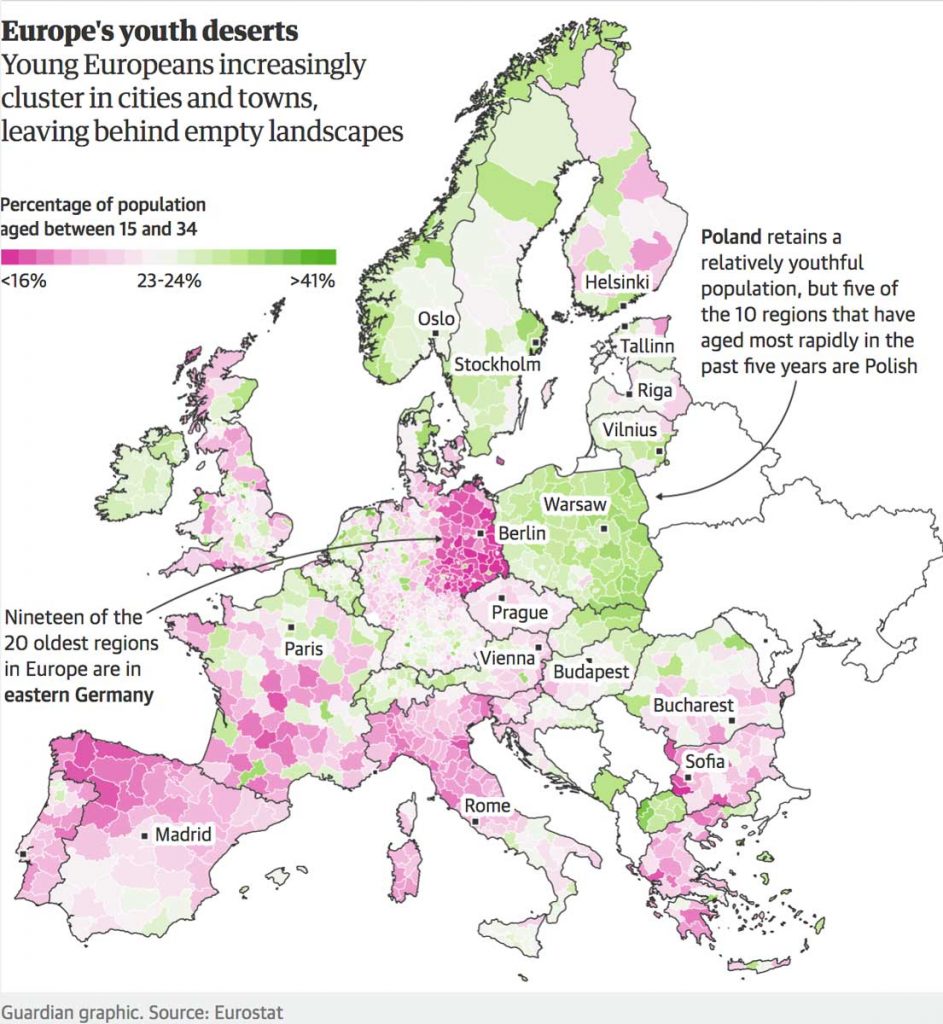
Not all towns and cities in North American and Europe have not shared in this growth. Even as most urban places have boomed, others have stagnated or declined, especially former industrial cities and remote small towns. Spain, for example, has recently been described as “hollowed-out” (La Espana Vaciada) because much of the interior has been turned into a youth desert, isolated small towns in France and Italy have almost no residents left, and in Canada entire rural settlements on the Prairies have disappeared.

The Bronx, New York City, 1988 
Saskatchewan small town 1991 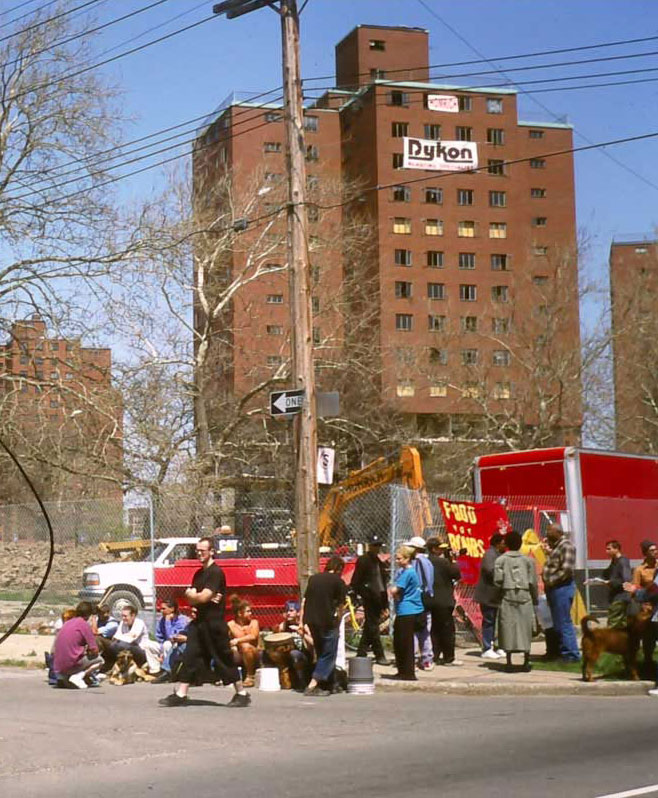
Detroit 2001
Instances of decline and abandonment in places since 1970. In the Bronx in 1980s there were streets of abandoned and brick-sealed buildings in the Bronx. The monument is the only evidence of a small town that flourished in the Canadian prairies from 1910 until it was abandoned in 1990 because the grain elevators that were the reason for its existence were no longer needed. The small crowd in Detroit had gathered to watch the demolition of the apartment building, one of several in a social housing complex that was being demolished.
Industrial cities in both North America and Europe that boomed from the 19th century to the 1960s and 70s have declined as manufacturing jobs have been shipped offshore and their technologies made obsolete. The population of Detroit has dropped from 1.8 million in 1950 to 700,000 now. Detroit is an extreme example, but most rustbelt cities and old industrial regions have seen some decline or stagnation. In these cases the obvious reasons have been economic and technological change, but in an age of low fertility rates and aging populations they are harbingers of the broader demographic phenomenon of “shrinking cities.” This is especially apparent in Japan, a nation which does not support immigration policies, has a fertility rate of just 1.4, an aging population mostly living in large cities, and is expected to experience a population decline of 20 million over the next 20 years. It is a moot question what will happen to neighbourhoods and streets as this happens.
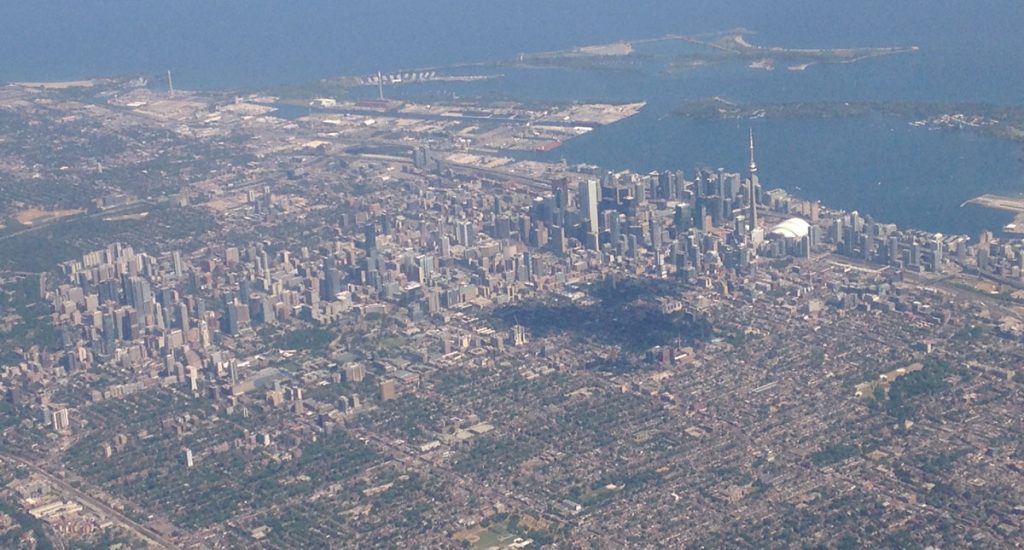
What I think has begun to happen is the emergence of urban place inequality that has developed in the current context of continuing population growth, aging populations and economic transformations, and is manifest at global, national and regional scales. At one extreme are cities that are so attractive they have developed great gravitational force, pulling in ever more people, and the bigger they get the more they attract. Then there are all the other places, many growing and changing relatively slowly, others slowly slipping into decline as people drift away and buildings are closed up or abandoned.
Persistence of the Place Practices of the Modern Era
Every historical period leaves a legacy of places for the future – both its built-environments and sets of practices and its attitudes about place that linger on. What I have described as the Modern Era, which lasted from about 1900 to 1970, was a period both of radical innovation in ways of making places, and a time of rapid population growth when the population of North America grew by about 150 million. Britain 18 million, France by 9 million, Italy by 22 million, the world by 2.1 billion. This has left a huge place inheritance that has four enduring manifestations.
First, most of the places created in the Modern Era still exist and are actively used – which is to say street patterns, institutions, parks, schools, apartment buildings, suburbs, new towns, airports, expressways. Places destroyed in the two world wars were largely rebuilt. The only notable exception is social housing complexes of modernist apartments (like the ones in Detroit illustrated above) that have been demolished because they proved to be more or less unlivable.
Secondly, and especially following WW2, the making of most of those places involved comprehensive planning. The academic planner Leonie Saundercock has described this as based in simplistic assumptions about objectivity and rationalism, and, according to Jane Jacobs, these contributed to urban renewal and “desegregated sortings” where the elements of places are pulled apart into categories of land use. Partly because of these criticisms the hard rationalist edges of planning have softened, but the general practice nevertheless persists, written into legislation and manifest in the official plans that municipalities everywhere are required to prepare in order to guide development and anticipate growth and change.
Thirdly, the modernist style of architecture conceived in the early decades of the 20th century, which used concrete, glass and metal to create undecorated, angular buildings, and was then widely used in the decades of growth and reconstruction following WW2 for institutions, office towers and apartments, continues to prevail. The designs now are sleeker, the shapes more complex, the buildings are often taller and larger, but their modernist genealogy is unmistakeable. They mark the cityscapes of prosperous, growing cities everywhere.
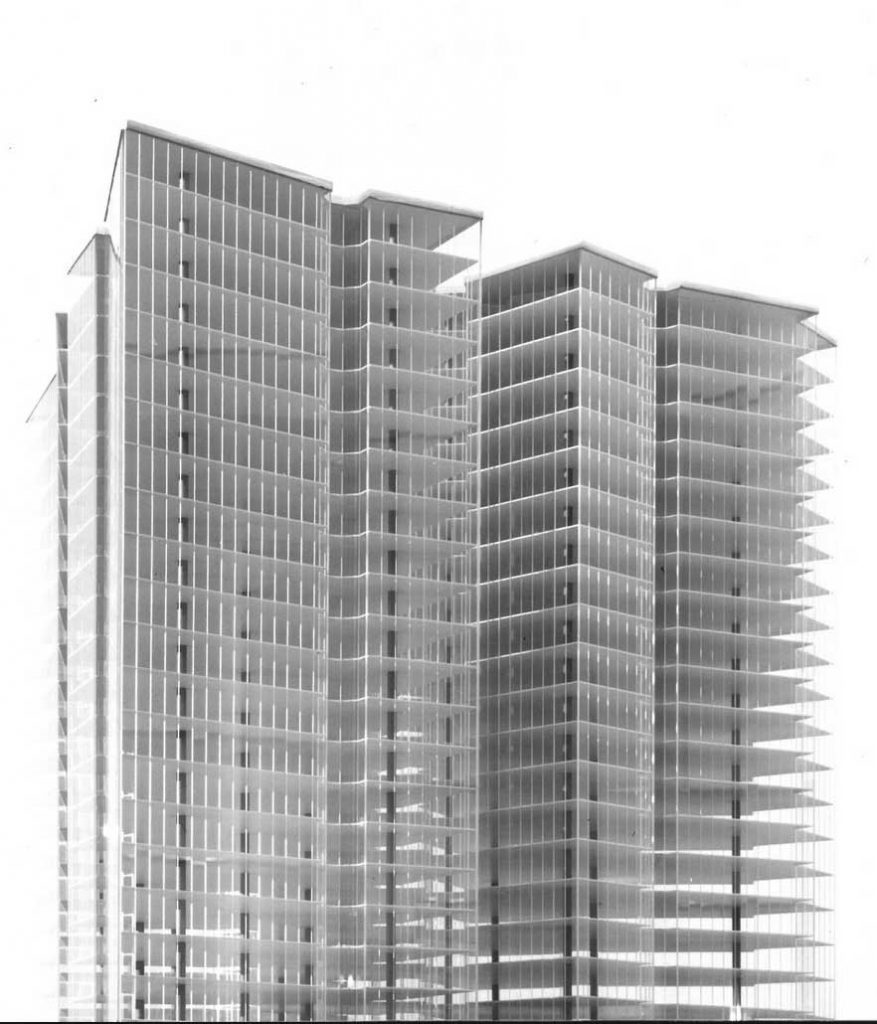
Mies van der Rohe’s proposal for Friedrichstrasse, 1921 (not built) 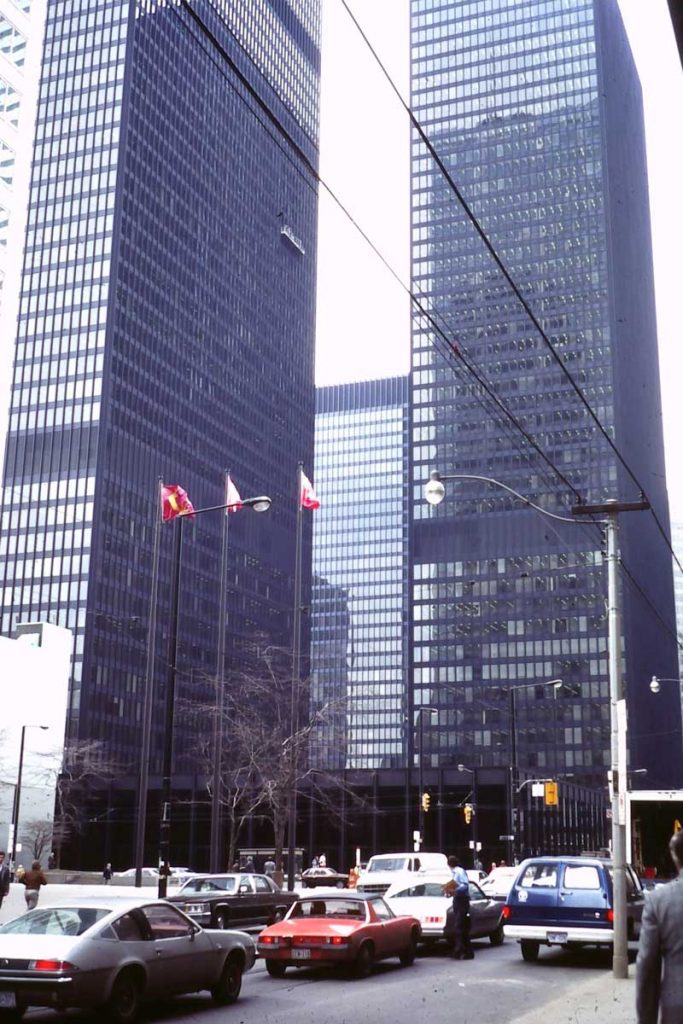
Mies van der Rohe, Toronto Dominion Centre 1967-69 
Part of downtown Calgary 2017
Fourthly, motor vehicles and the paraphernalia associated with them, continue to play the key role in how places are made that began with the mass production of Model Ts in 1908. The popular enthusiasm for motor vehicles has not diminished. Motor vehicles requires asphalt surfaces, highways and motorways designed for speed, street lights, service stations, parking lots, garages traffic signals and roundabouts, and drive-to shopping centres. These continue to be dominant elements of placemaking.
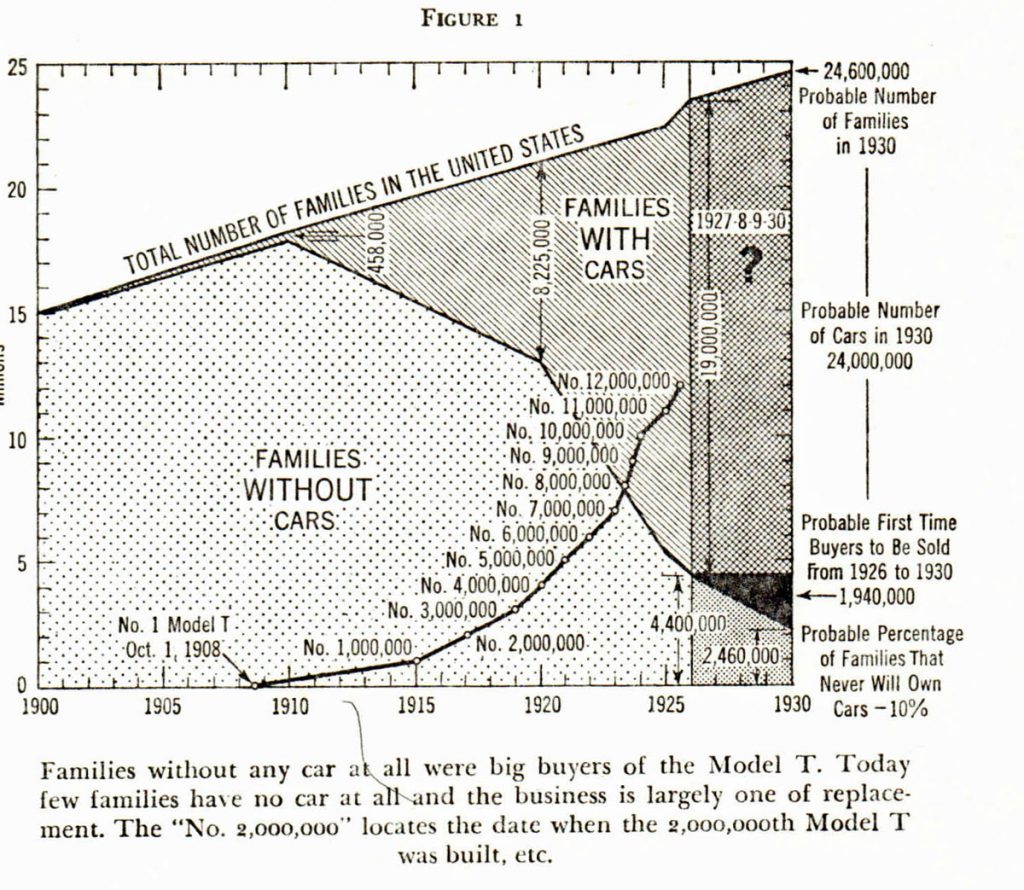

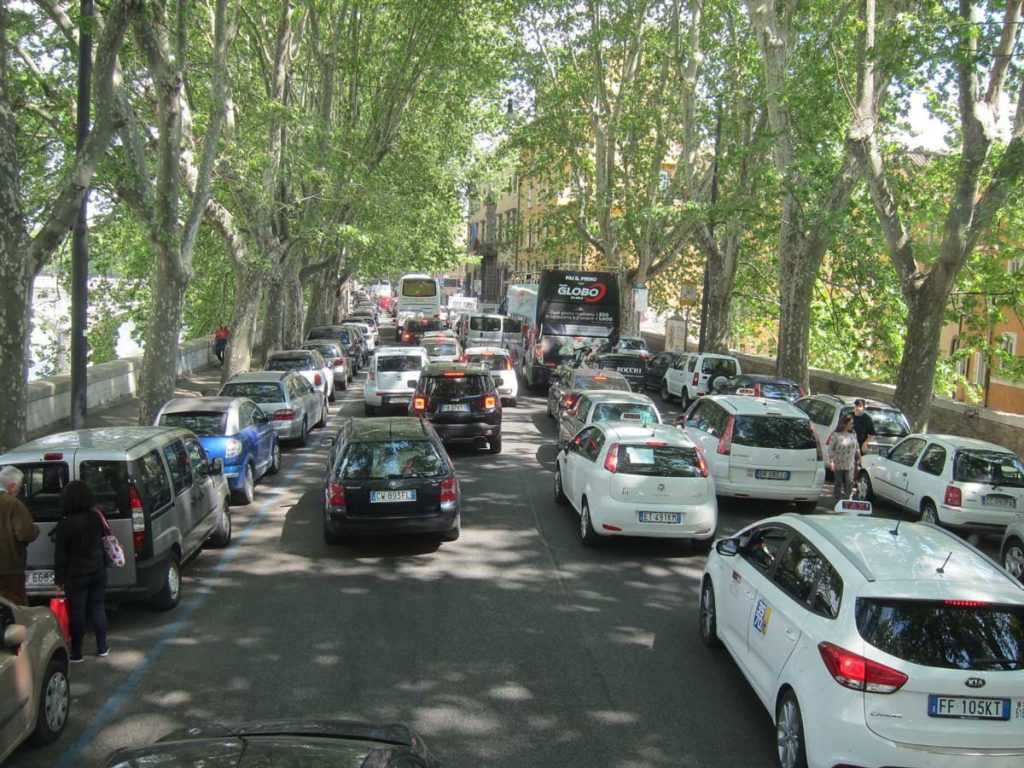
An interesting diagram from The Motorist in 1926 showing families with and without cars since 1900; a mid-century modern house with its contemporary car in Palm Springs, California (in 2016); motor vehicles in Rome (2017).
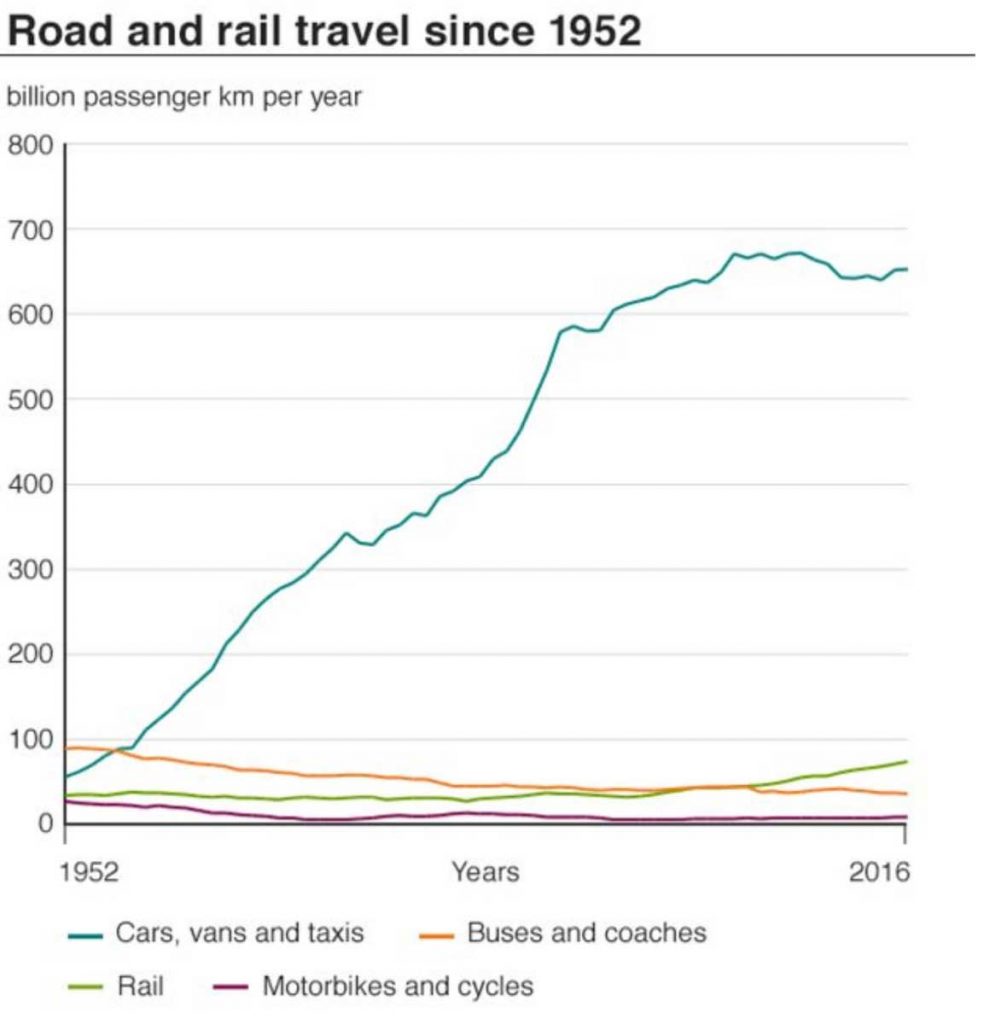
While it is a frequently expressed hope of urban planners that cars will decline in popularity and large areas of cities will be pedestrianised, and some of that has happened locally, the fact is that motor vehicle use has increased faster than population. In 1970 there were 250 million motor vehicles in the world, in 2016 there were 1.32 billion, so the numbers of vehicles quintupled as global population doubled. The same disparity applies even in Europe: in 2014 the population of the European Union was 507 million, and there were 284 million motor vehicles; in 2018 the population was 512 million and there were 308 million motor vehicles – 5 million more people but 24 million more vehicles. A recent audit of increased investments for public transportation and bicycle infrastructure, that were initiated in 2014 in the EU, found that they have had no significant impact on private car usage. I am not enthusiastic about this, but the clear indications are the machine-friendly characteristics of places associated with motor vehicles, which began to be created a century ago, have not only endured but show few signs of vanishing in the near future.
—————————————–
The next post will consider changes and trends in ways of making and experiencing places between about 1970, when the practices of the Modern Era were brought into question, and 1990, when the world wide web was invented and a new wave of place impacting practices began.